Creating Reports
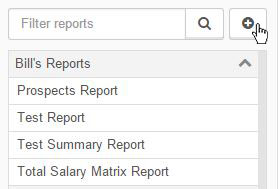
To create a new report, go to Reports. Then click the plus sign icon next to the reports search bar.

The first step to creating a custom report is to chose what type of report is to be created. Once you have chosen one of the available types of reports, click the Next button.

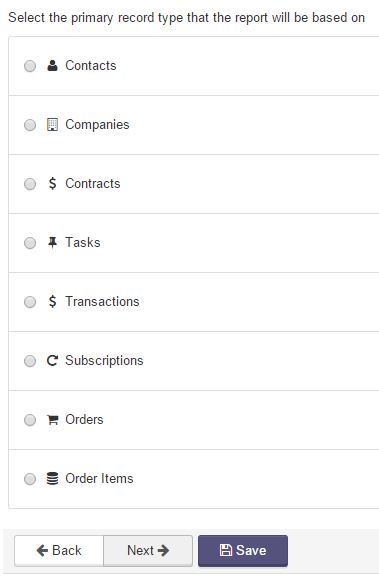
The next step is to chose what type of records the report will be based on. Make a selection from the available record types, then click the Next button.
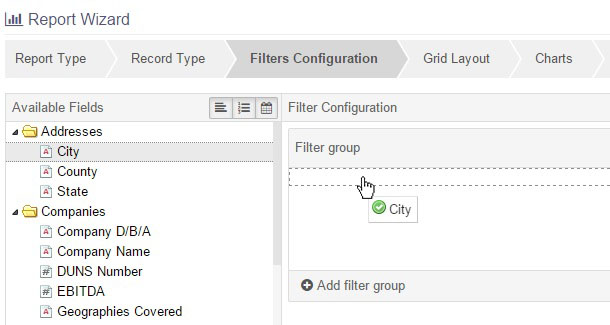
The next screen allows you to chose what fields the report will filter by. Drag the desired field into the filter group and drop it into place.
Chose what response you want filtered and by what response it should be filtered by.
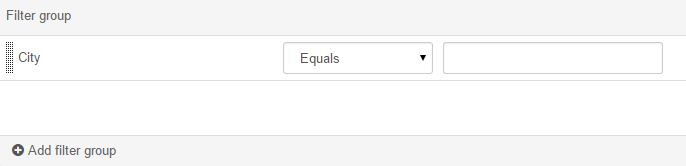
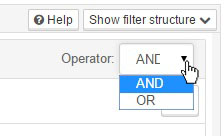
Use the filter operator to switch the filters from AND/OR. Once all options are complete, click the Next button.
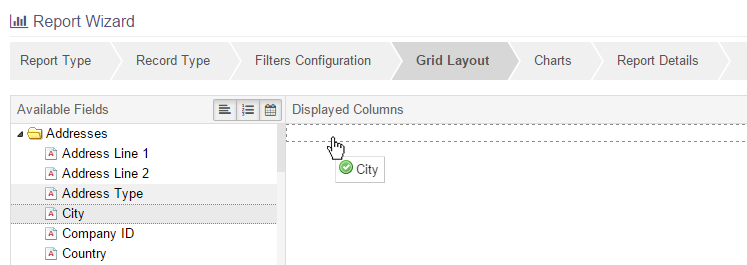
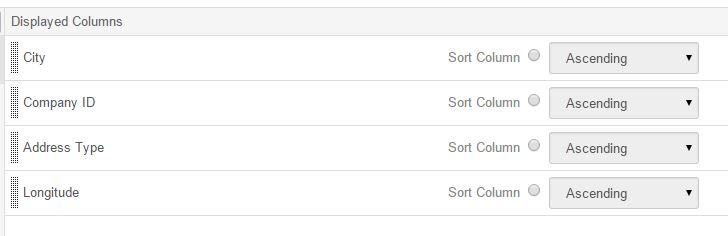
Once the filters are set, you can set the grid layout for the report. Use the same drag and drop function for each field that will be displayed in the grid. Chose the order by dragging and dropping field into the desired position. One column can be sorted to decide the order of the record in the report. Once all options are configured, click the Next button.
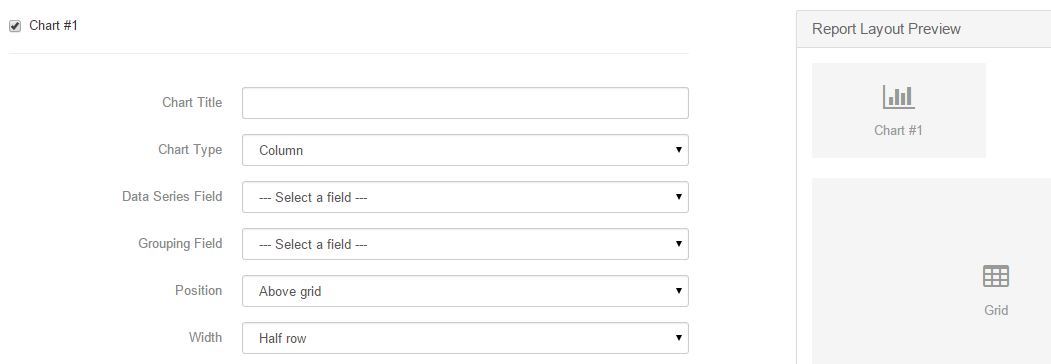
Optionally, 1 or 2 charts can be displayed in the report. Use the following options to configure charts, then click the Next button.
- Chart #: Check this box to open the chart.
- Chart Title: The text that is displayed above the chart in the report.
- Chart Type: How the chart's data is visually represented. Chose from a column, bar, pie, or line graph.
- Data Series Field: A numerical field that the chart aggregates from the report's data set, based on the chart's grouping field.
- Grouping Field: The field that the chart groups the reports data set by. Note that most free text field are not available to use here.
- Position: The placement of the chart within the report.
- Width: The relative width of the chart in relation to the entire report.
The last step is creating report details.
- Report Title: The text displayed in the report's header and in the reports list. Reports titles must be unique within the system.
- Category: The category folder that the report will be placed under in the reports list.
- Dashboard Panel: The dashboard panel can be optionally created for the report, which will display the selected report component; either the data grid or one of the charts if they are enabled. Users with access to the report will also have permission to the panel.
- Report Access: The users in the system that can view the report. Only the report creator and system administrators can edit or remove report. Global reports are accessible by all users in the system.

When all fields are filled out, click the Save button to create the report. The report can be found in the reports list.
Articles in this section
Have an additional question about any of the tools that you answered? Submit it here, and we will be in contact to help you!